
Council Rates for 2025/26
Rates notices are now being sent out and both the Gold Coast Bulletin and a variety of social media "commentators" have been making remarks about rate increases, and about Councillor transparency regarding the budget processes. Some of this criticism might be considered well placed but some probably is misplaced, given the complexity of the processes councillors are expected to navigate as they make decisions.
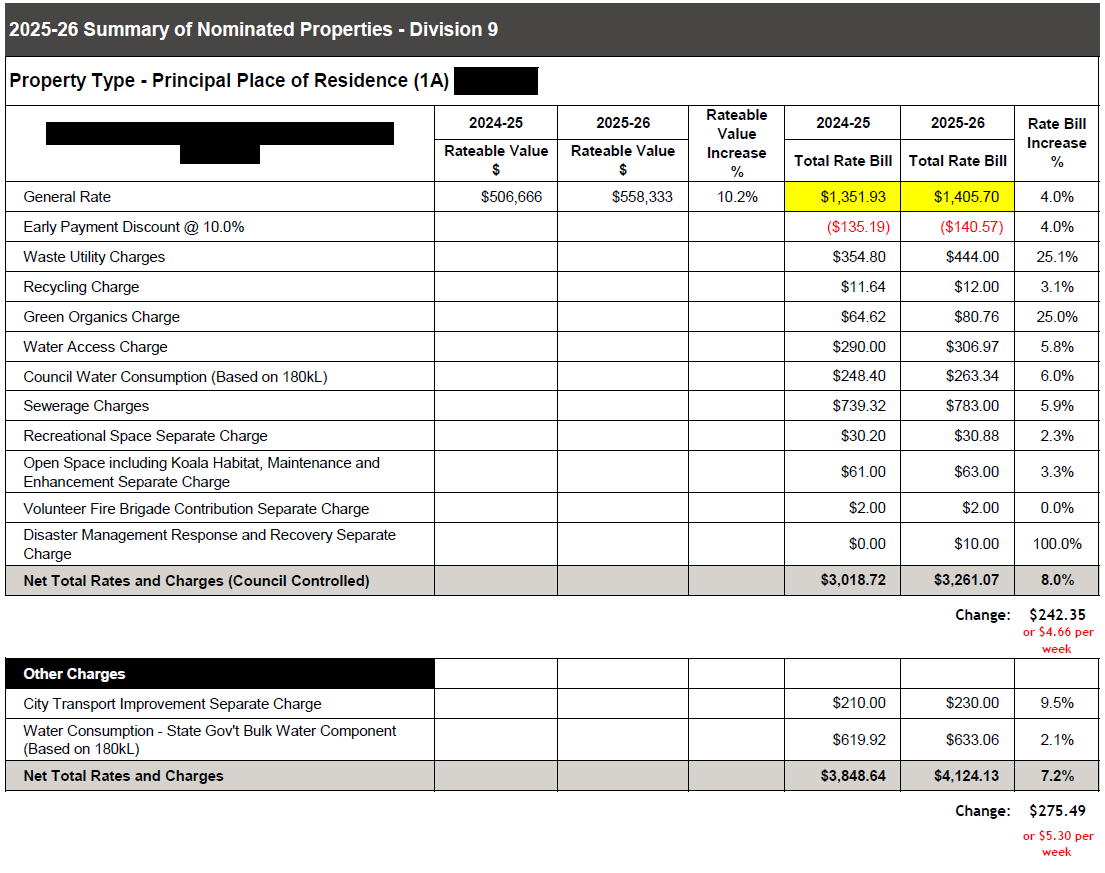
An excerpt from the information on my rates notice for 25/26
For the sake of transparency, and now that rates notices are being sent to residents, I'm sharing information about my own rates notice (see image below), where it shows my property has increased in value by 10.2% and my general rate has increased by 4% (which I acknowledge is higher than the 2.7% (CPI) noted in official media statements by others). One reason for the larger general rate increase is because my property valuation (averaged over three years) increased by 10.2% - which is higher than the City-wide average change of 7.68%. The other items on the example are charges common to most rate notices. Overall this year, Jude and I will be paying about $5.30 per week more than last year. We live in a small-ish 3 bedroom ensuite house with a pool and a studio/shed in Mudgeeraba, not far from Mudgeeraba State School.
During budget discussions at the relevant Council committee, each of the categories are tested for fairness and equity against each other. It’s not a perfect science and requires some complex analysis, particularly with such varying land valuation fluctuations in the city.
Officers undertake analysis and make recommendations to Councillors, who also may do some of their own analysis as they form their view.
Here’s a couple of insights, specifically for the general rate (and not including other charges like transport charge or waste utility charge);
- Of the 93,748 residential owner-occupied non-strata properties (walk-up homes) in the city, 70,309 had a general rate rise of 2.7% or less (That’s 75% of the category). This includes 21,513 properties of this type who had a rate decrease.
- Of the 38,163 residential owner-occupied vertical strata properties on the 5th floor or under, 35,427 had a rate rise of 2.7% or under, including 4767 had a decrease. That’s 93% of the category.
- 40,794 residential properties in the city (of the 255,342 total residential properties – that’s 16%) obtained a decrease in their general rate. That was a product of a proportional decrease in their land value compared to changes in the rest of the city.
- 149,126 residential properties in the city (58% of residential) received a rate increase of 2.7% or under (including those who actually got a decrease). That does not include the categories for commercial or tourist rentals properties some of whom also fell within that group.
- 101,350 residential properties in the city (40% of all residential) experienced an increase of between 2.7% and 7.5%. That outcome was a product of the proportional land valuation change compared to the rest of the city and some other considerations. In this group of properties, 30% of the properties were units under the 5th floor in vertical strata.
The underlying “fairness and equity” principle in this process (what we test against) is that similar properties from a living/space perspective, and market valuation, should pay approximately the same rates. It doesn't always work, and there are some anomalies, but Councillors do their best to debate officer recommendations based on the data analysis.
There’s obviously lots of other categories with many less dwellings, and on the rate bill there’s a variety of different charges that are devised through various legislative responsibilities of council, but on the property rates specifically, this is some of the data in some of the most prominent categories. Hope it's helpful.
If you have questions about your rates notice, please reach out to my office at division9@goldcoast.qld.gov.au, or contact my office on 5581 1883 to make a time to chat.